

Most IT leaders can tell you their tool cost. Almost none can tell you what their service desk actually costs per ticket — and that gap is exactly where the CFO conversation goes sideways.
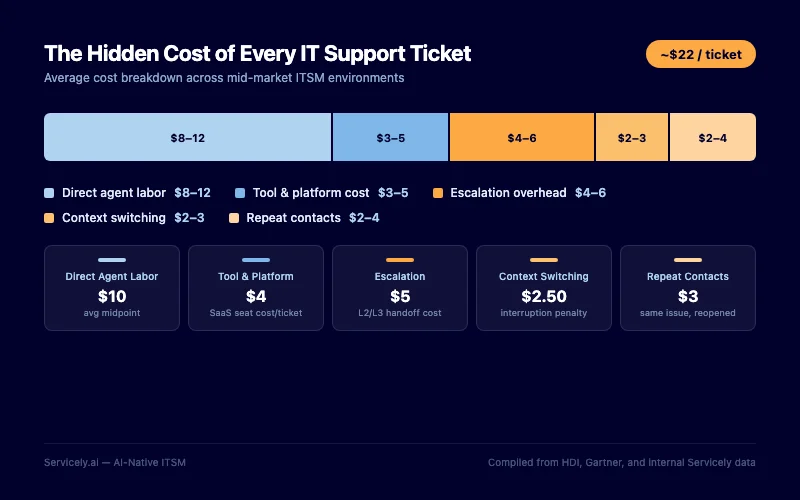
Here's the number that changes the conversation: the average manually-handled IT service desk ticket costs $22. That's not the software subscription. That's the fully loaded cost of a human touching a ticket — agent time, overhead, escalation, the employee productivity lost while waiting for resolution. For an organisation handling 1,000 tickets a month, that's $22,000 a month, $264,000 a year, just in handling cost. Before you add a single dollar of licensing.
AI-native ITSM changes that equation in three places simultaneously: it deflects tickets before they become tickets, it resolves the ones that do come in faster, and it frees your analysts to work on the 20% of issues that actually need a human. This post breaks down exactly how to calculate the ROI — with real numbers, real math, and the worked example your CFO will actually ask for.
Why the Standard ITSM ROI Calculation Is Wrong
The traditional ITSM ROI argument goes like this: the platform costs X, it saves Y in headcount, Y minus X equals ROI. That math is wrong — not because it's dishonest, but because it's incomplete.
It misses two cost categories that are often larger than the headcount savings themselves.
The first is employee lost productivity. When an analyst is stuck triaging password resets and access requests — the same 30 tickets they've handled 300 times — they're not doing the infrastructure work, the security work, or the project delivery that your organisation actually needs them for. According to Gartner, up to 70% of a service desk agent's time is consumed by low-value, repetitive work. You're paying Level 2 and Level 3 salaries for Level 0 problems. That's not a headcount problem. That's an architecture problem.
The second is end-user lost productivity. Every ticket that takes 6 hours to resolve instead of 6 minutes is 6 hours of a salesperson, accountant, or operations manager working around a broken system, waiting on IT, or working offline. That cost is invisible in your ITSM dashboards, but it shows up in your business outcomes.
The right ROI framework accounts for all three: ticket handling cost, analyst capacity recapture, and end-user productivity recovery. Run all three and the numbers get large quickly.
The ROI Calculation Framework, With Real Numbers
Let's build the model from the ground up. This is the framework we use with IT leaders who are walking into a board or CFO conversation about ITSM investment.
Step 1: Establish your baseline ticket cost
Industry benchmarks put the average manually-handled ticket at $22. That figure covers agent time, management overhead, tooling allocation, and facilities. If you have a fully-loaded cost for your team, use that instead. If you don't, $22 is a defensible floor based on consistent benchmarking from Gartner and HDI.
Step 2: Calculate your current annual ticket handling cost
Take your monthly ticket volume and multiply by 12, then by $22.
| Monthly Ticket Volume | Annual Tickets | Cost at $22/ticket |
|---|---|---|
| 500 | 6,000 | $132,000 |
| 1,000 | 12,000 | $264,000 |
| 2,500 | 30,000 | $660,000 |
| 5,000 | 60,000 | $1,320,000 |
These figures don't include platform licensing, implementation, or management overhead. Pure ticket handling.
Step 3: Apply AI deflection and resolution rates
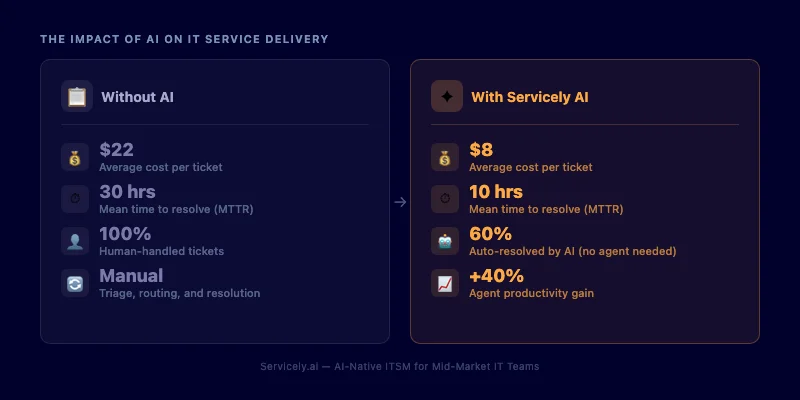
This is where AI-native ITSM changes the math. The platform resolves 60% of requests via AI-assisted self-service and automation — before a human analyst ever touches the ticket. For a 1,000-ticket-per-month organisation, that means 600 tickets resolve at near-zero marginal cost. The AI handles the password reset at 2am. The access request approves automatically through pre-set rules. The onboarding workflow runs end-to-end without a single analyst keystroke.
The 400 tickets that do reach an analyst arrive pre-classified, pre-prioritised, and with relevant knowledge articles already surfaced. Resolution time drops by 75% on average. Analyst productivity increases by 40%.
Step 4: Calculate your post-AI cost
The 600 AI-resolved tickets cost approximately $2–4 each in compute and automation overhead (consistent with Gartner's self-service cost benchmark). The 400 analyst-handled tickets cost significantly less than $22 because the AI has done the triage work — call it $12 per ticket as a conservative estimate.
| Scenario | 1,000 tickets/month | Annual cost |
|---|---|---|
| Before AI (all manual at $22) | $22,000/mo | $264,000 |
| After AI (60% deflected at $3, 40% assisted at $12) | $6,600/mo | $79,200 |
| Annual savings on ticket handling alone | $184,800 |
That's the conservative number. It excludes the analyst capacity you've freed up and the end-user productivity you've recovered. Add those in and the figure climbs substantially.
Step 5: Add analyst capacity value
If 60% of your tickets are handled by AI, your analysts aren't idle — they're available to do the work they were actually hired to do. A team of 5 analysts recovering 40% of their time is the equivalent of 2 additional headcount. At a $75,000 fully-loaded analyst cost, that's $150,000 in capacity recovered annually. You're not cutting staff — you're doing more with the team you have.
Want to run these numbers against your own service desk?
We'll walk through the ROI calculation with you in a 30-minute session — using your actual ticket volume, team size, and current tool costs. No slides. Just your numbers.
Book a personalised ROI session with Servicely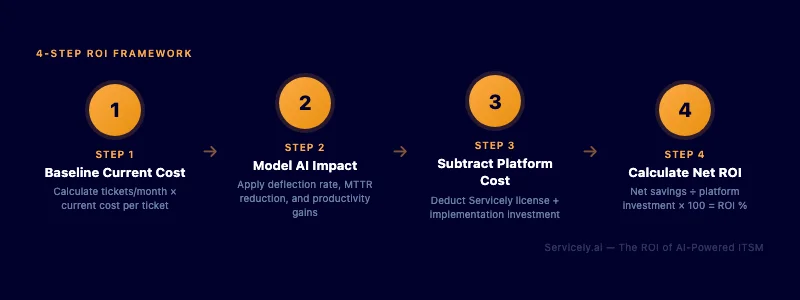
Interactive ROI Calculator
Adjust the inputs below to model your environment. Results update instantly.
Based on Servicely deployment benchmarks. Platform cost estimated at $50/agent/month. Actual results vary by environment.
What Does 300% Faster MTTR Actually Mean in Dollars?
Mean Time to Resolution is one of those metrics IT teams track and CFOs ignore — until someone translates it into business cost.
Here's how to do that translation. Take any business-critical incident: a CRM outage, a payroll system failure, a VPN issue affecting remote workers. If that incident affects 50 employees for 4 hours, and those employees cost an average of $40/hour fully loaded, that's $8,000 in lost productivity from a single incident. Every hour you shave off MTTR in a major incident is worth thousands.
Servicely customers see a 300% improvement in MTTR — that's resolution in a quarter of the previous time. For organisations that historically resolved P1 incidents in 8 hours, that means 2 hours. For those at 4 hours, that means 1 hour. The math on what that means for a business that has even 5 P1 incidents per quarter is significant.
Beyond the major incidents, the cumulative effect of faster resolution on routine tickets is where the real money sits. HDI benchmarks put best-in-class service desk MTTR at under 4 hours. Less mature operations average a full business day or more. Faster resolution means employees get back to work faster. At scale — 1,000 tickets per month across an organisation where average employee cost is $35/hour — even a 1-hour average reduction in resolution time is worth $420,000 annually in recovered employee productivity.
That number belongs in your business case. Most IT leaders never include it because it's harder to attribute. But the CFO who asks "what's the cost of IT downtime?" absolutely wants to see it.
The Hidden Cost Nobody Puts in the Business Case
The cost of staying where you are is real. It just doesn't show up on an invoice.
Consider what your current ITSM setup costs in three ways most organisations don't measure:
The ServiceNow overage problem. If you're on ServiceNow, you're paying for a platform architected for organisations 10x your size. The licensing model forces uplift at renewal. The implementation requires consultants. The configuration requires certified specialists you either hire or retain at $200+/hour. One telecommunications organisation that moved to Servicely reduced their platform costs by 73% and their overall service management costs by 40%. That's not a vendor claim pulled from a slide — it's a line item in their accounts.
The analyst turnover problem. Entry-level service desk roles have some of the highest turnover rates in IT. When your analysts spend 70% of their time on password resets and ticket sorting, they leave. Replacing an analyst costs 50–100% of annual salary in recruitment, onboarding, and lost productivity during ramp. AI-native platforms reduce analyst attrition because the work becomes more interesting — the routine volume is handled by automation, and analysts spend their time on problems that actually require expertise. That's not a soft benefit. It's a measurable cost reduction in your HR budget.
The scale trap. Traditional ITSM scales linearly: more users mean more tickets mean more headcount. AI-native ITSM breaks that relationship. IOR reduced incident volume by 50% without reducing services. Design to Production cut on-site response processes in half and reduced incident resolution times by 50%, without adding headcount. The ability to grow your organisation without growing your service desk is a strategic asset that belongs in the CFO conversation.
How to Build the CFO-Ready Business Case
Every CFO conversation about ITSM investment comes down to the same three questions: What does it cost today? What will it cost after? How long until we break even?
Here's how to answer all three with numbers they'll accept.
Current state cost (the "cost of doing nothing")
Add those four lines. The total will surprise most IT leaders — and most CFOs. The majority of organisations have never calculated it.
Future state cost (post-AI-native ITSM)
Payback period
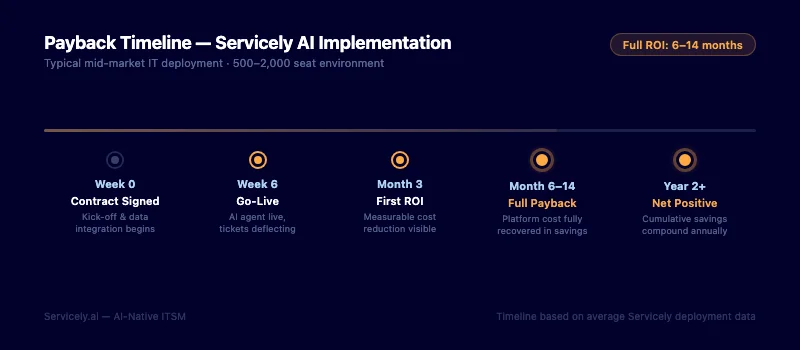
Take the annual delta between current state cost and future state cost. Divide by the implementation and first-year licensing cost. For most mid-market organisations at 1,000 tickets/month, the payback period lands between 6 and 14 months. Some customers hit it faster. The BUCS IT deployment, for example, reduced IT service billing preparation times by 92% — a result that showed up in their books within months of go-live, not years.
Servicely implementations run 6 weeks on average. That's not a pilot. That's full deployment — workflows configured, virtual agent trained, integrations live. The time-to-value in the business case is 6 weeks to go-live and 2–3 months to measurable ROI. That's a CFO-friendly investment profile.
What "AI Native" Means — and Why It Changes the Math
This distinction matters for the business case. Not all ITSM platforms with "AI" in the marketing deck are the same.
Bolted-on AI is a module added to a legacy platform architecture. The ticketing system was built for humans to process. The AI sits on top as an overlay — it can suggest responses, maybe auto-classify tickets, but the underlying workflow still requires human touchpoints because the system was never designed to operate without them.
AI-native means the platform was architected from the ground up with the assumption that AI would handle the majority of volume. The workflow engine executes autonomously. The virtual agent resolves, not just deflects. The knowledge base is continuously updated by AI. The classification, prioritisation, and routing are machine-driven with human escalation as the exception, not the rule.
That architectural difference is why the 60% AI resolution figure is achievable consistently. A bolted-on AI system can't get there because the ticket still has to flow through a process built for humans. An AI-native system routes around the human touchpoints entirely when the ticket doesn't need one.
It's the difference between an electric car and a petrol car with an electric starter motor. Both have electric components. Only one was built to run on them.
For the business case, this means the deflection numbers are sustainable — not just achievable in the first quarter when the configuration is fresh. The system learns. The automation coverage improves over time. The ROI compounds.
Want numbers specific to your environment?
Book a 30-minute ROI review — we'll build your model together. Your ticket volume, your team size, your current tool costs. No generic slides.
Servicely customers average 40% productivity increase, 60% AI resolution, 300% faster MTTR.
Frequently Asked Questions
Most mid-market organisations see measurable ROI within 3–6 months of go-live. Servicely's average implementation runs 6 weeks, meaning the platform is fully live — not piloting — within two months of contract signing. Payback period on the full investment typically falls between 6 and 14 months, depending on ticket volume and current platform costs. Organisations migrating from ServiceNow tend to see faster payback because the cost delta is larger from day one.
Start with your total annual service desk cost — salaries, benefits, management overhead, tooling, and facilities allocated to the function. Divide by your annual ticket volume. The industry benchmark is $22 per manually-handled ticket, but organisations with higher-cost labour markets or complex escalation paths often run $30–40. If your number is lower than $15, double-check that you're including all fully-loaded costs, not just salary. The calculation tends to surface hidden costs that change the investment justification significantly.
Not necessarily — and most IT leaders don't want it to mean that. The more common outcome is that the same team handles significantly higher volume, or that analysts shift time from Level 1 routing to Level 2 and 3 work. The organisations seeing the strongest ROI are using the capacity freed by AI to expand IT services, accelerate project delivery, and improve response on high-complexity issues — not to cut headcount. Whether the benefit shows up as cost reduction or capacity expansion is a strategic choice you make, not one the platform makes for you.
The architectural difference is significant. An AI module overlaid on a legacy platform can suggest responses and auto-classify tickets, but the underlying workflow was built assuming human touchpoints at every stage. An AI-native platform was architected for autonomous resolution — the virtual agent resolves, the workflow executes, and humans are involved only when the issue genuinely requires them. That's why the deflection rates differ substantially: bolted-on AI typically deflects 15–25% of volume; AI-native platforms routinely achieve 50–70% resolution without human intervention.
The 6-week figure is full deployment — virtual agent trained, workflows configured, CMDB populated, integrations to your directory and key business systems live, and self-service portal available to end users. It's not a sandbox or a proof-of-concept. One large local council completed full deployment in this timeframe. The speed comes from Servicely's configuration-over-customisation approach: the platform is built for mid-market IT environments, so the baseline configuration fits without months of custom development work.
Deflection means the user was redirected to a knowledge article or self-service form before a ticket was created — the issue may or may not have been resolved. Resolution means the AI or virtual agent fully handled the request and closed it without human involvement. Servicely's 60% figure is resolution, not deflection. That distinction matters for the ROI calculation: deflected tickets may still generate a follow-up ticket if the user doesn't find what they need; resolved tickets are closed. The cost savings attached to resolution are more reliable and more defensible in a business case.